The economy of Texas was a standout among states before the recent climb in energy prices. Now, it’s shifted into overdrive.
 Featuring neither personal nor corporate income taxes, ‘business friendly’ is one of the key descriptors being used to explain the rollicking growth success of the Lone Star state.
The following bullet points highlight some of the areas where Texas and its major cities possess a superior ranking, beginning with some construction measures.��
- Among America’s 12 most populous cities, Houston and Dallas-Ft Worth rank 1st and 2nd for year-over-year increase in number of construction jobs, +6.2% and +5.9%;
- Among America’s 12 most populous cities, Dallas-Ft Worth (231,500) and Houston (222,500) rank 3rd and 4th for number of construction jobs (behind N.Y. and L.A.);
- Among all states, and despite a decline of one-quarter (-24.6%) in dollar volume, Texas ranks 1st in year-to-date nonresidential building construction starts ($28.7 billion through May 2022) (see Table 1);
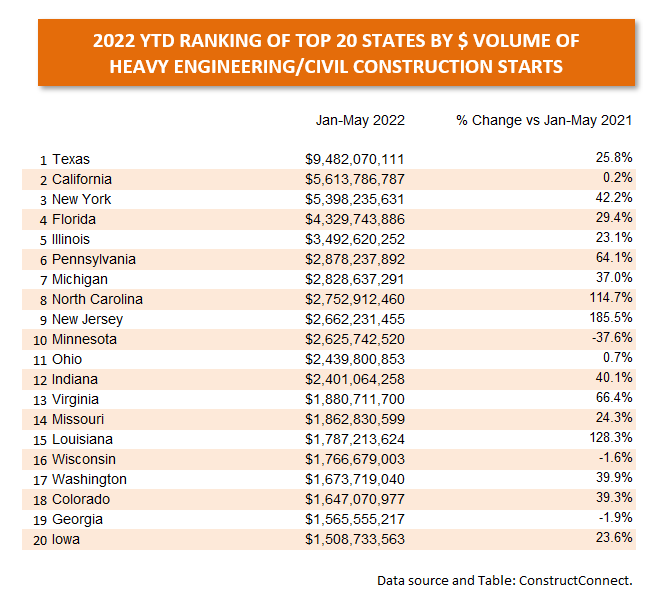
- Among all states, and with a one-quarter year-to-date increase (+25.8%) in dollar volume, Texas ranks 1st in engineering/civil construction starts ($9.5 billion through May 2022) (see Table 2);
- With a year-over-year gain of +6.1%, Texas ranks 1st among all states for total number of jobs created (the construction jobs count change has been +7.1% y/y);
- In April year-to-date housing starts, 3 cities in Texas were among the Top 5 for number of units, with Dallas-Ft Worth 1st (27,693), Houston 2nd (26,614) and Austin 5th (16,599) (link to previous story );
- With launches by Blue Origin from Van Horn (high on the border with Mexico) and by SpaceX from Boca Chica (near Brownsville), Texas has become home to the new space tourism industry;
- On a related note, and inspired by the presence of the National Aeronautics and Space Administration (NASA), one nickname often applied to Houston is Space City;
- For 2021, Texas ranked 1st among states in U-Haul’s data series, for net number of one-way truck journeys entering versus leaving each state;
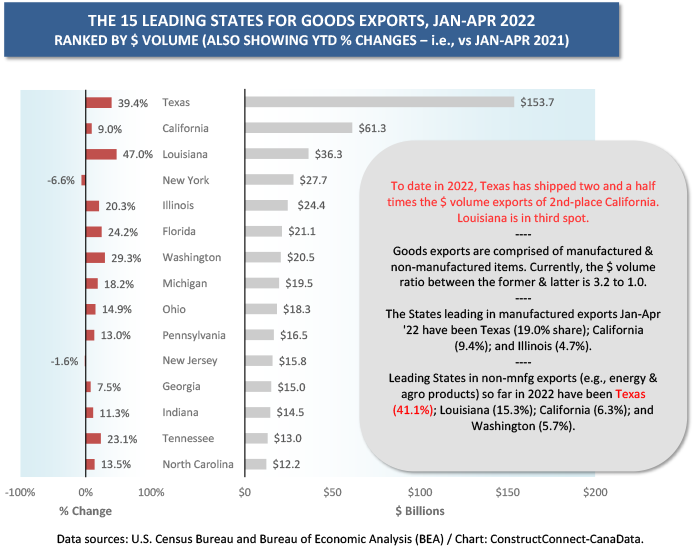
- For 20 years in a row, Texas has been number 1 among all states for export dollar sales volume, and the gap with 2nd-place California has been widening;
- Through April 2022, the dollar volume of export shipments by Texas was two-and-a-half times greater than by 2nd-place California and four times more than by 3rd-place Louisiana (see Graph 1);
- In non-manufacturing exports (mainly energy products), Texas is number 1 by a vast margin, currently accounting for a 41.1% share of the U.S. total, way ahead of 2nd-place Louisiana, with a 15.3% share (see text box accompanying Graph 1).
- In the year prior to the arrival of the coronavirus, Texas was 1st among states for nominal population increase, +374,000 individuals, considerably outpacing 2nd-place Florida’s +241,000 (Texas has been drawing a lot of its new arrivals from California);
- Caterpillar, Hewlett Packard, Oracle, and Tesla are among the celebrated companies that have already moved, or say they will be moving, their headquarters to Texas;
- Finally, watch for Texas to capture even more attention for some of its major construction projects underway or planned, including utility-sized battery storage units (Tesla); a cyber-truck gigi-factory in Austin (Tesla); an enormous computer wafer manufacturing facility north of Dallas (Texas Instruments); another computer chip manufacturing plant near Austin (Samsung); more LNG exporting capacity (Sempra); and rapid transit and high-speed rail possibilities.
��
A Boom Underway in Alberta Energy Product Exports
��North of the border, Alberta is Canada’s dominant energy-producing province, and its economy has been perking up, of late, thanks to the improvement in natural gas and crude oil prices.
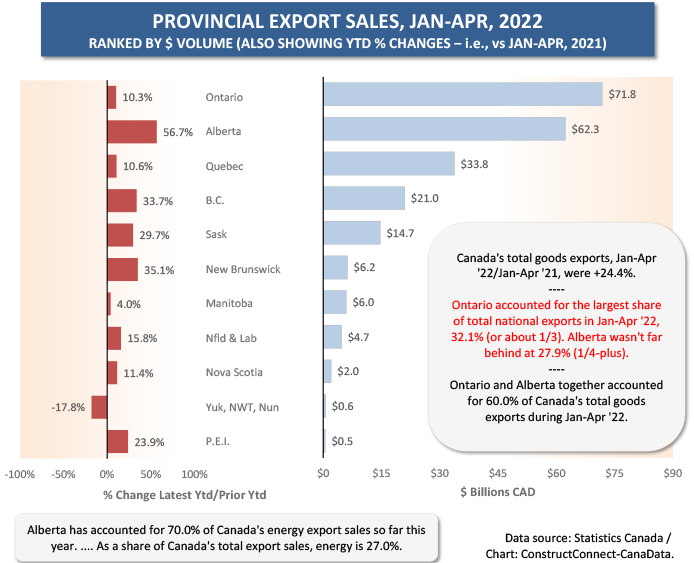
Canada’s total exports by dollar volume are +24.4% so far in 2022, compared with January-April 2021. Energy product exports, as a subset, are +75.7%.
Energy product exports are now claiming a 27% share (or more than a quarter) of Canada’s total export shipments. ��Alberta is the primary provincial source, contributing 70% (or more than two-thirds) of nation-wide energy product exports.
Thanks to the price-driven revival in its oil and natural gas sectors, Alberta has managed the biggest percentage increase in total exports year to date in 2022, +56.7% (see Graph 2).
Their respective shares of Canada’s population may be 12% and 39%, but Alberta is recording a dollar volume of export sales ($62.3 billion) that isn’t far off the frontrunner pace being set by Ontario ($71.8 billion) (see Table 3).
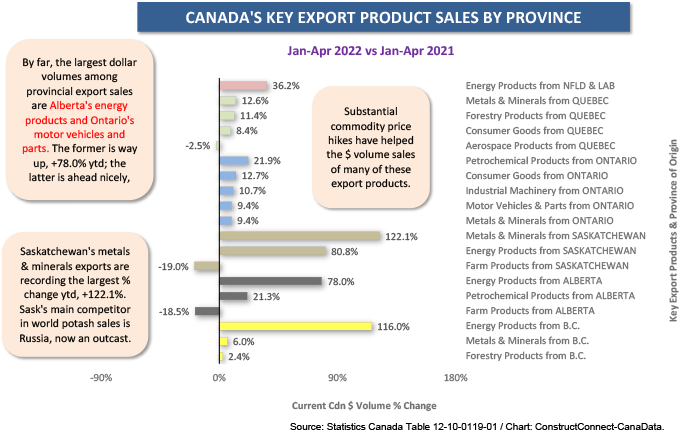
Not to mince words, there’s a boom underway in Alberta’s energy product exports, as appears clearly evident in Graph 3, and it’s pulling along employment gains in its slipstream.
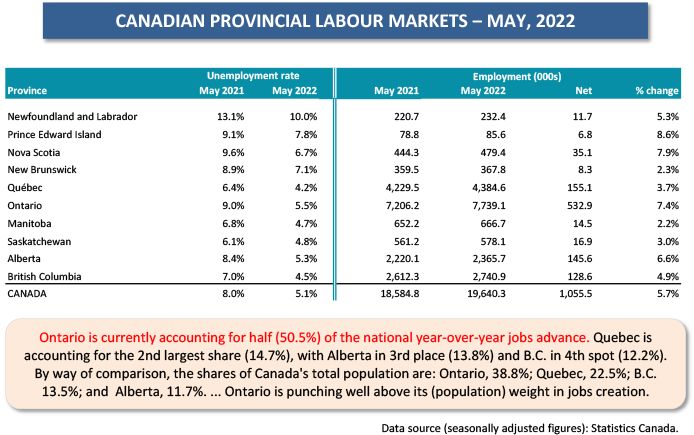
With respective population shares of 12% and 22%, Alberta’s year-over-year jobs creation, at +146,000 has been nearly a match for 2nd-place Quebec’s +155,000 (see Table 3). (Ontario is the nation’s true jobs-creation juggernaut, with plus half a million net new positions year over year – click on earlier article .)
Alberta still has an unemployment rate (5.5% SA) that is above the national average (5.1%), but it’s a far cry from the double-digit percent level (11.4% as the monthly average) that was touched on in 2020 when pandemic panic sent the global price of oil into a tailspin.��
Table 1
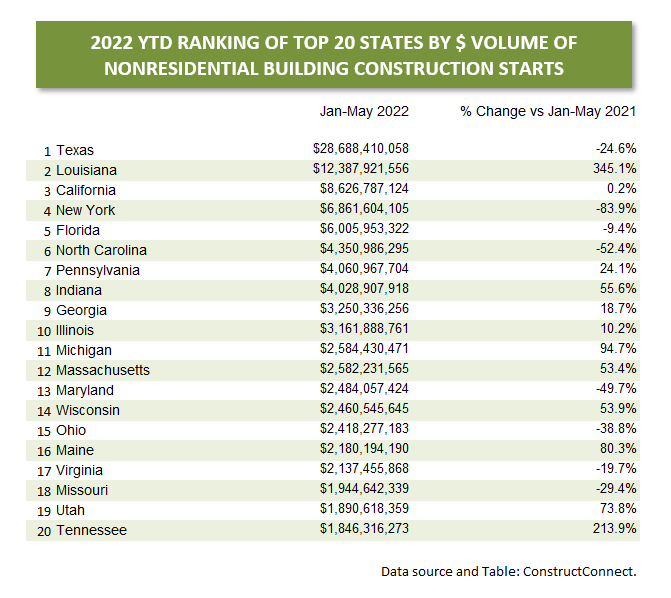
Table 2
Graph 1
Graph 2
Graph 3
Graph 4

Table 3
Alex Carrick is Chief Economist for ɫ��ɫ. He has delivered presentations throughout North America on the U.S., Canadian and world construction outlooks. Mr. Carrick has been with the company since 1985. Links to his numerous articles are featured on Twitter��, which has 50,000 followers.


Recent Comments
comments for this post are closed