A few days ago, ɫ��ɫ posted an article on U.S. construction material cost increases that can be accessed through clicking on this .
Now it’s Canada’s turn.
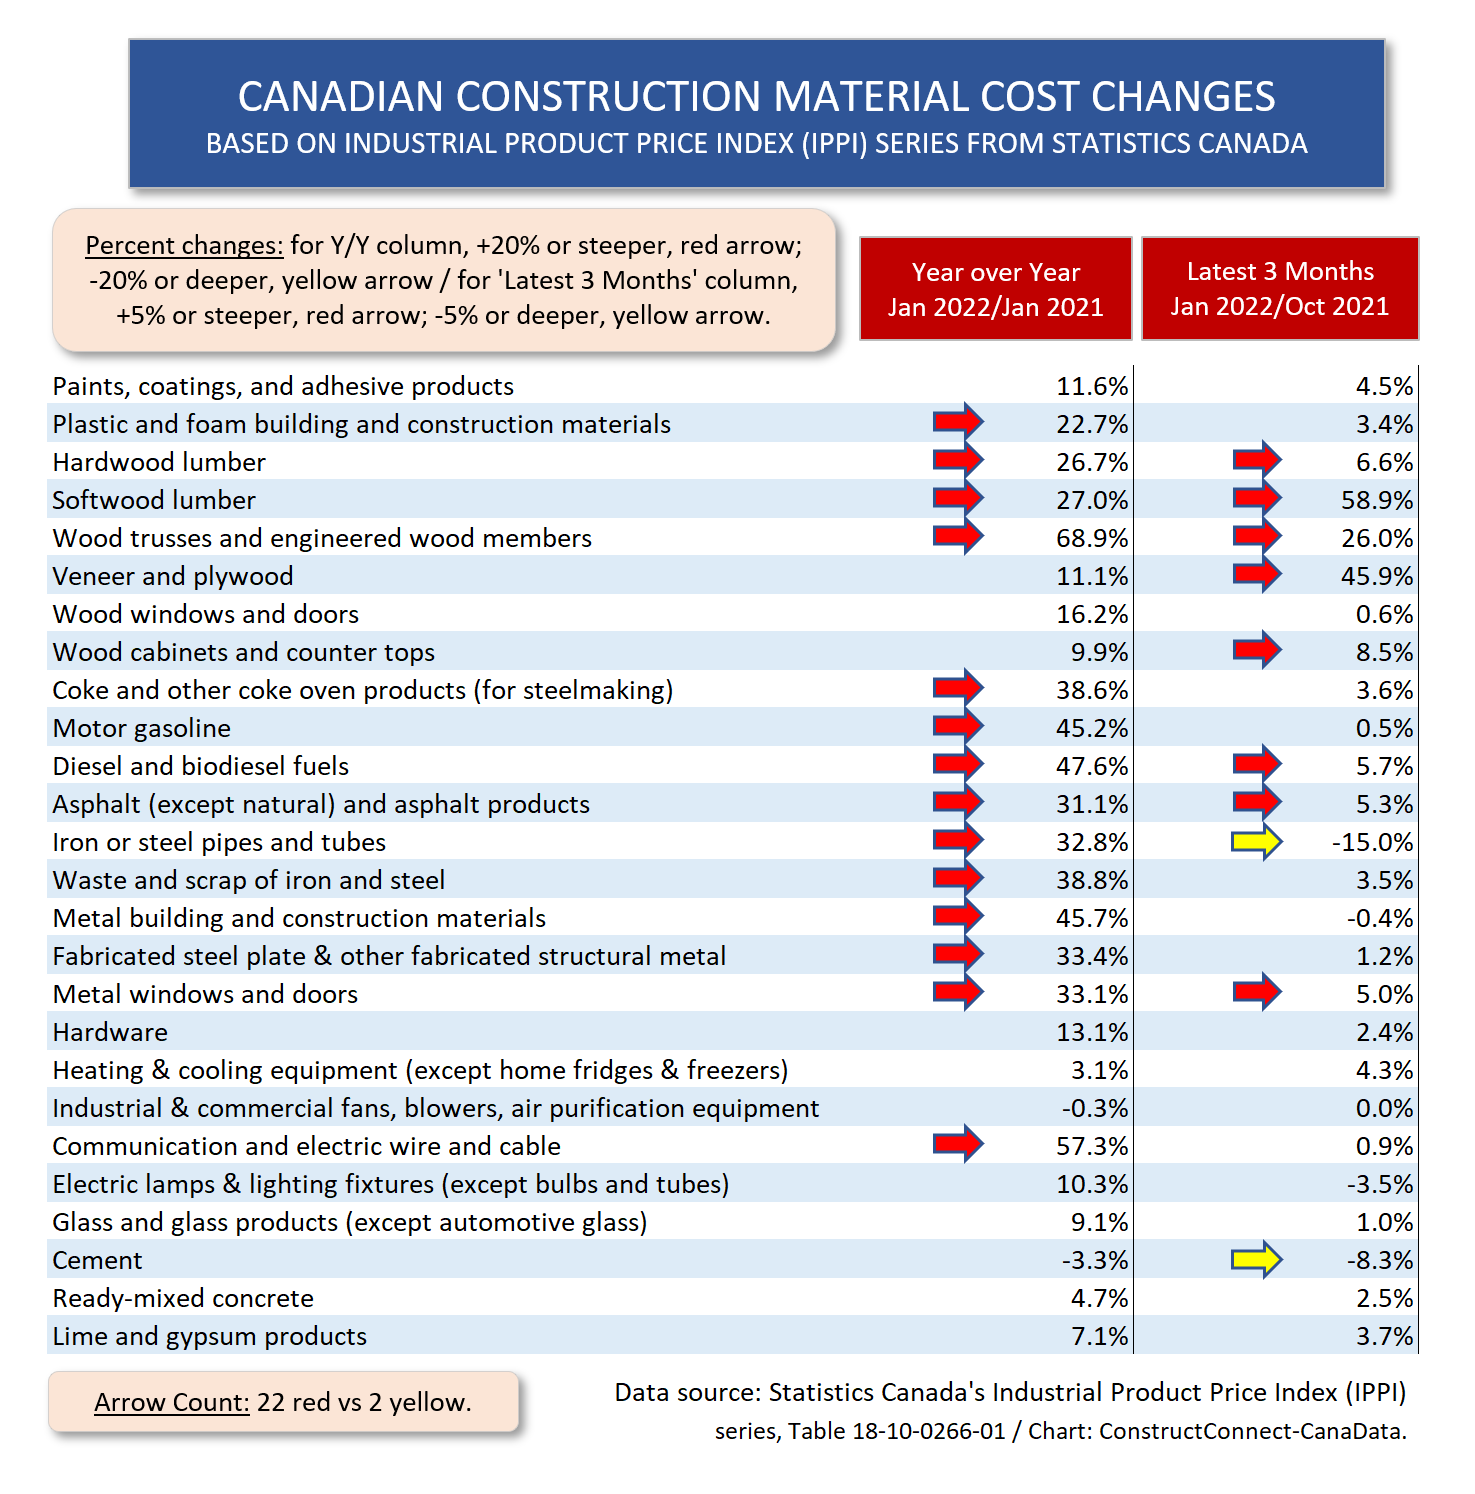
 Table 1 below sets out Industrial Product Price Index (IPPI) data from Statistics Canada. The IPPI material is the Canadian equivalent of the Producer Price Index (PPI) information from the U.S. Bureau of Labor Statistics (BLS).
The table highlights year-over-year and latest-three-month results for 26 material or other inputs into Canadian construction projects.
Red arrows alert the reader to when the percentage change is +20% or more in the year-over-year column; and when the percentage change is +5% or more in the latest-three-months column (i.e., January 2022 versus October 2021).
The yellow arrows point to significant declines and presently only appear in the latest-three- months column.
There are a lot of red arrows. The count is 22 reds to only two yellows. Clearly, outsized input cost hikes are every bit as prevalent in Canada as in the U.S.
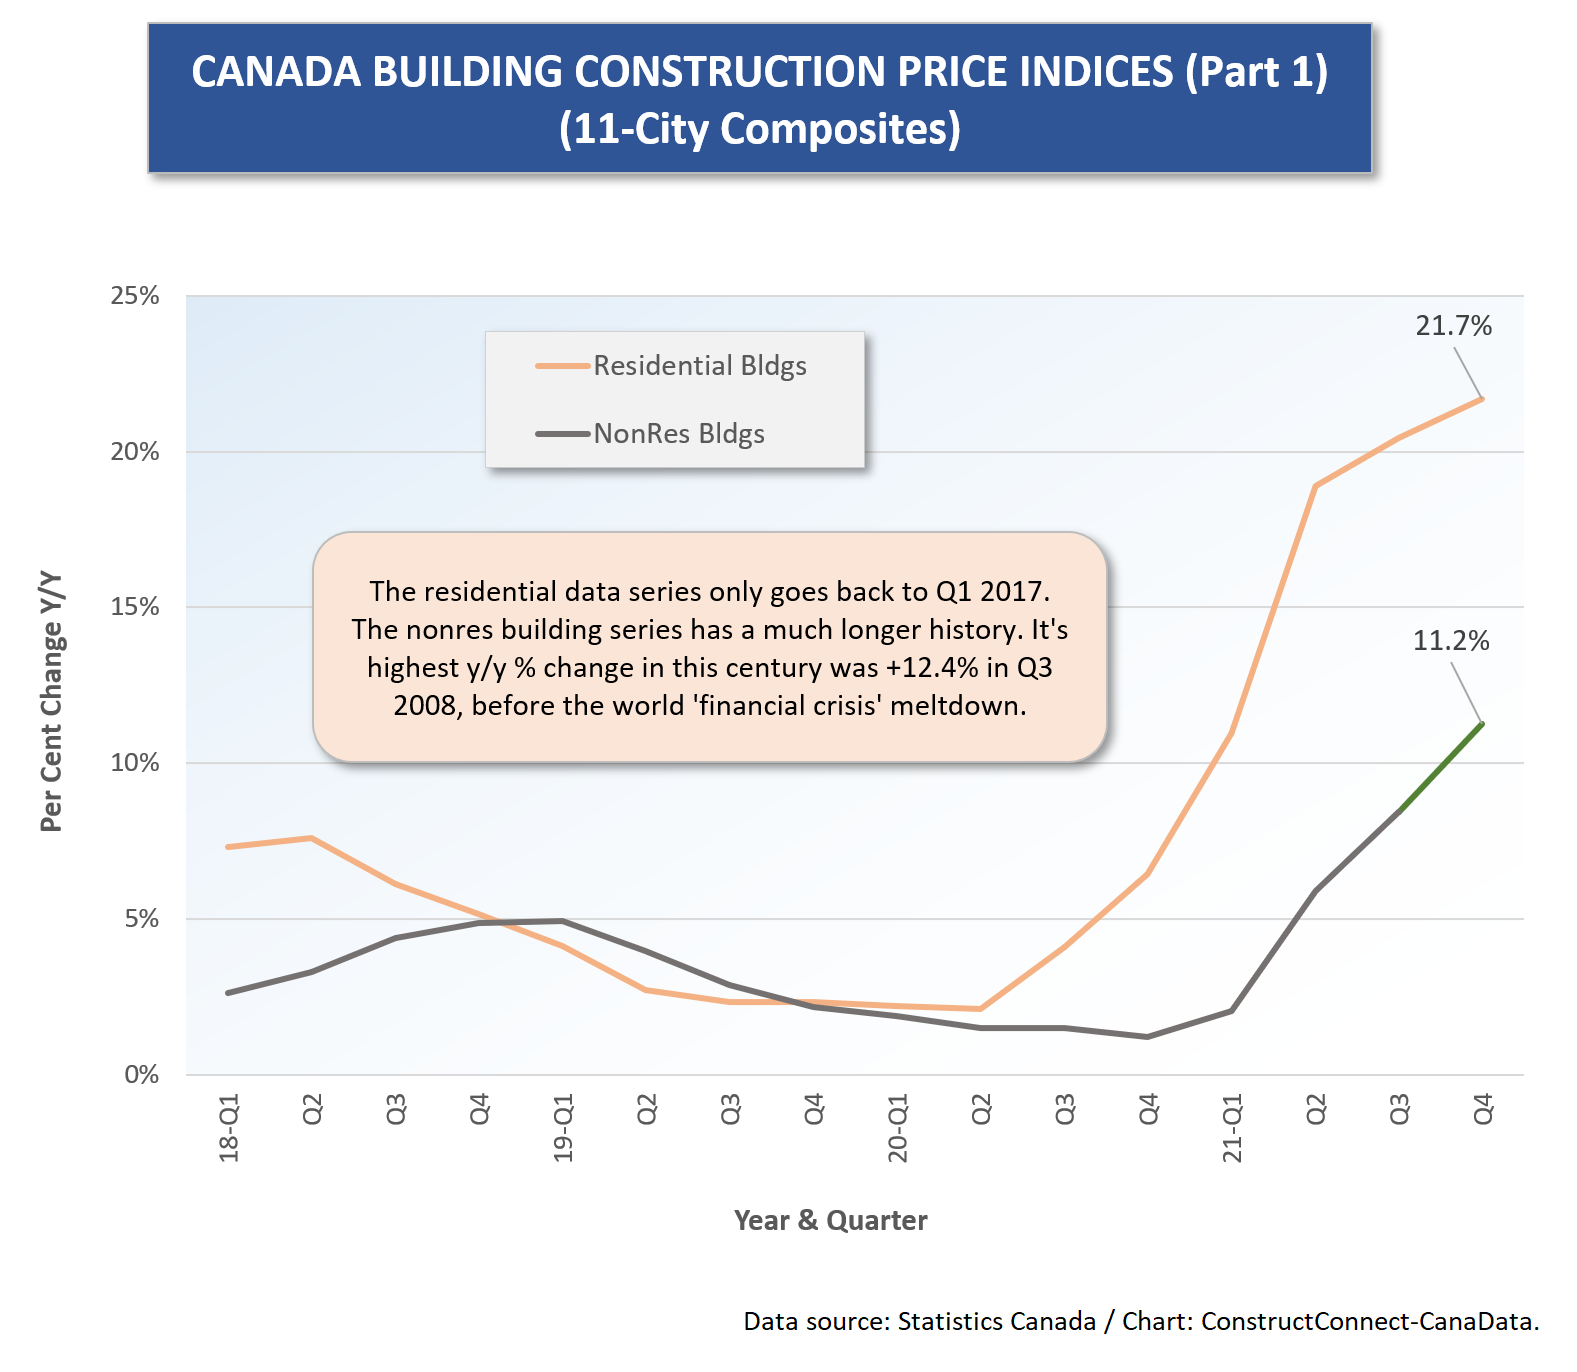
Graph 1 sets out what spiking in input expenses has meant for the cost of construction across Canada, although it only goes up to the final quarter of last year. Just the same, without even accounting for the latest input cost advances, the 11-major-city composite index for residential buildings leapt ahead by +21.7% in Q4 2021.
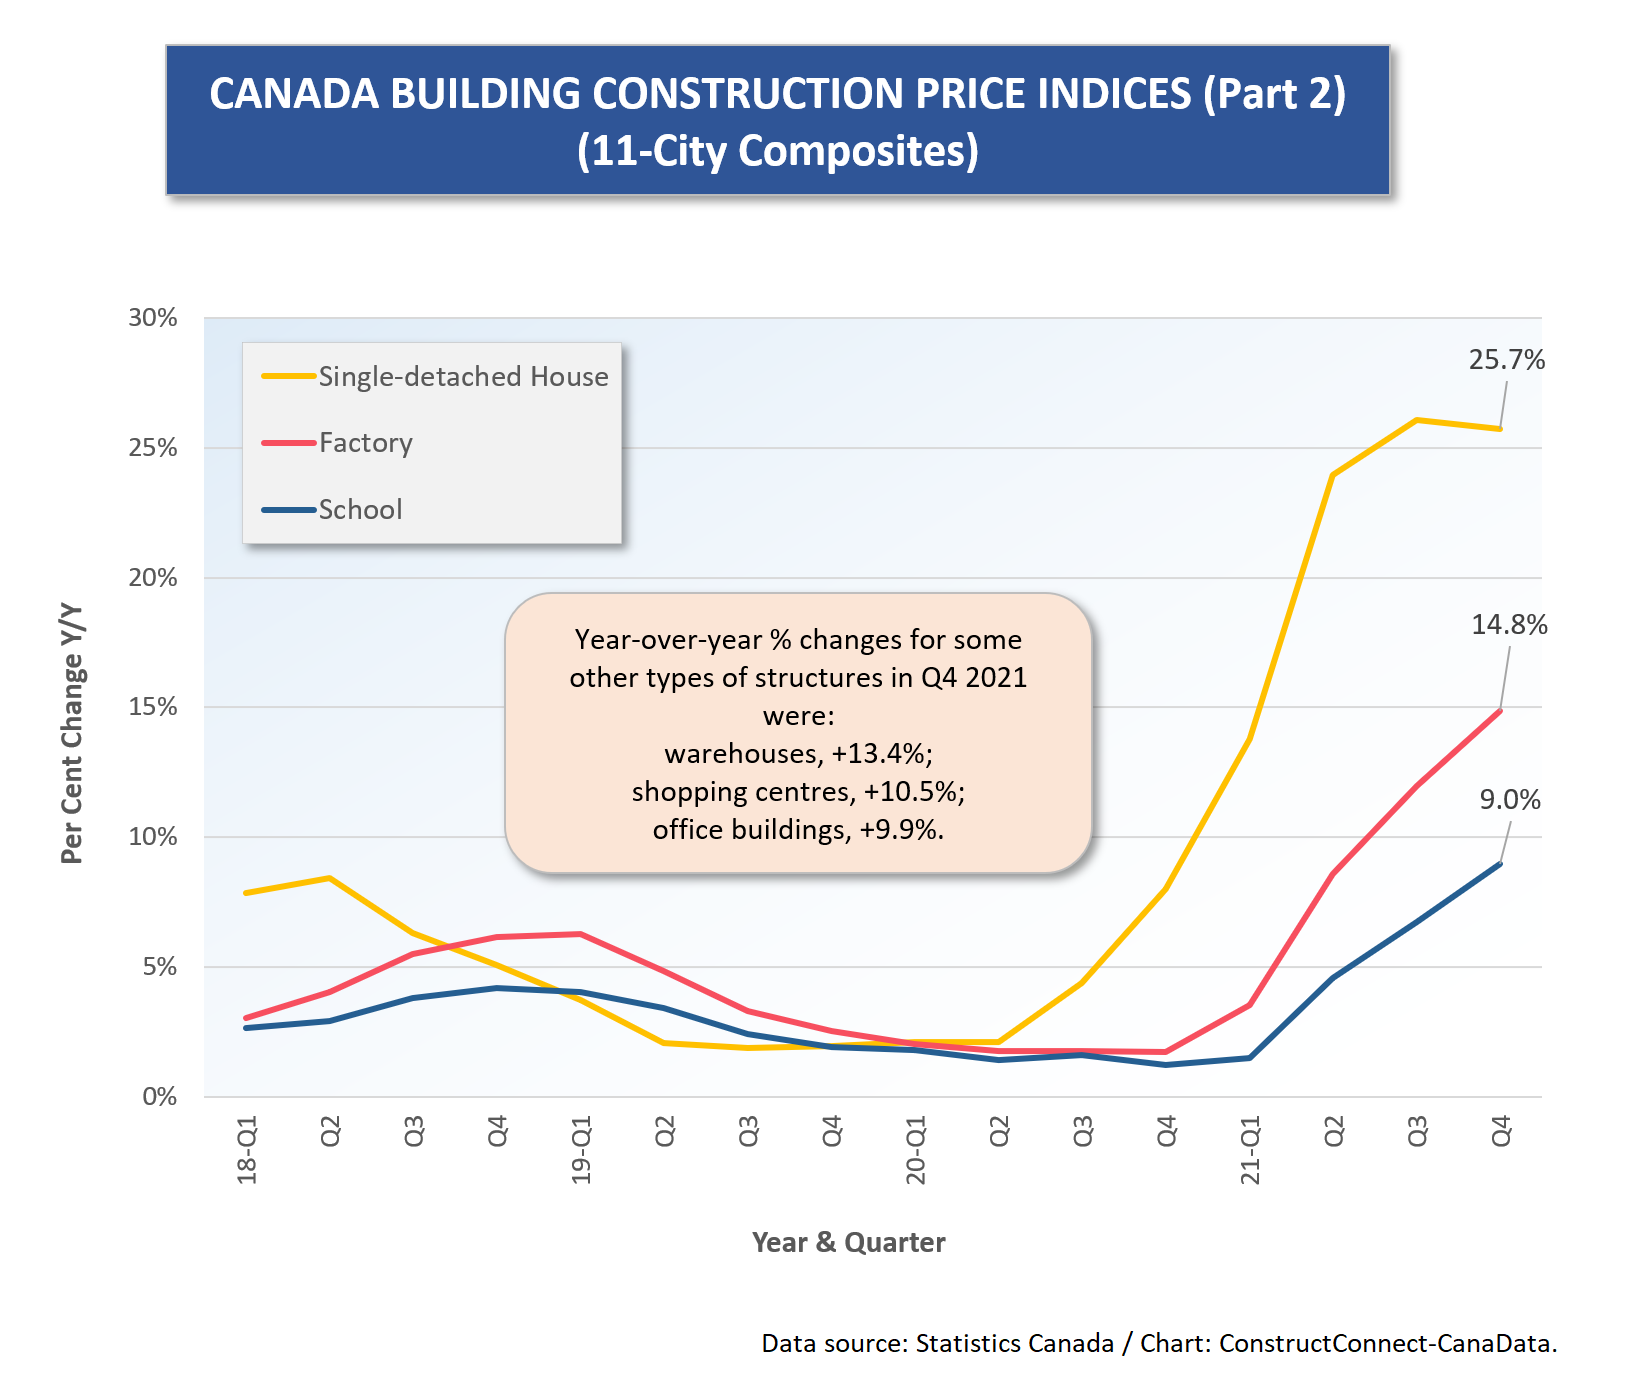
Contained within that +21.7% figure for total residential was a +25.7% y/y jump for single-family detached housing. Tower residential (i.e., above 5 stories) was +14.5% y/y.
The overall nonresidential buildings increase, while not as great as for residential, was still substantial at +11.2% y/y. The factory component was +14.8% y/y and warehouses were +13.4%.
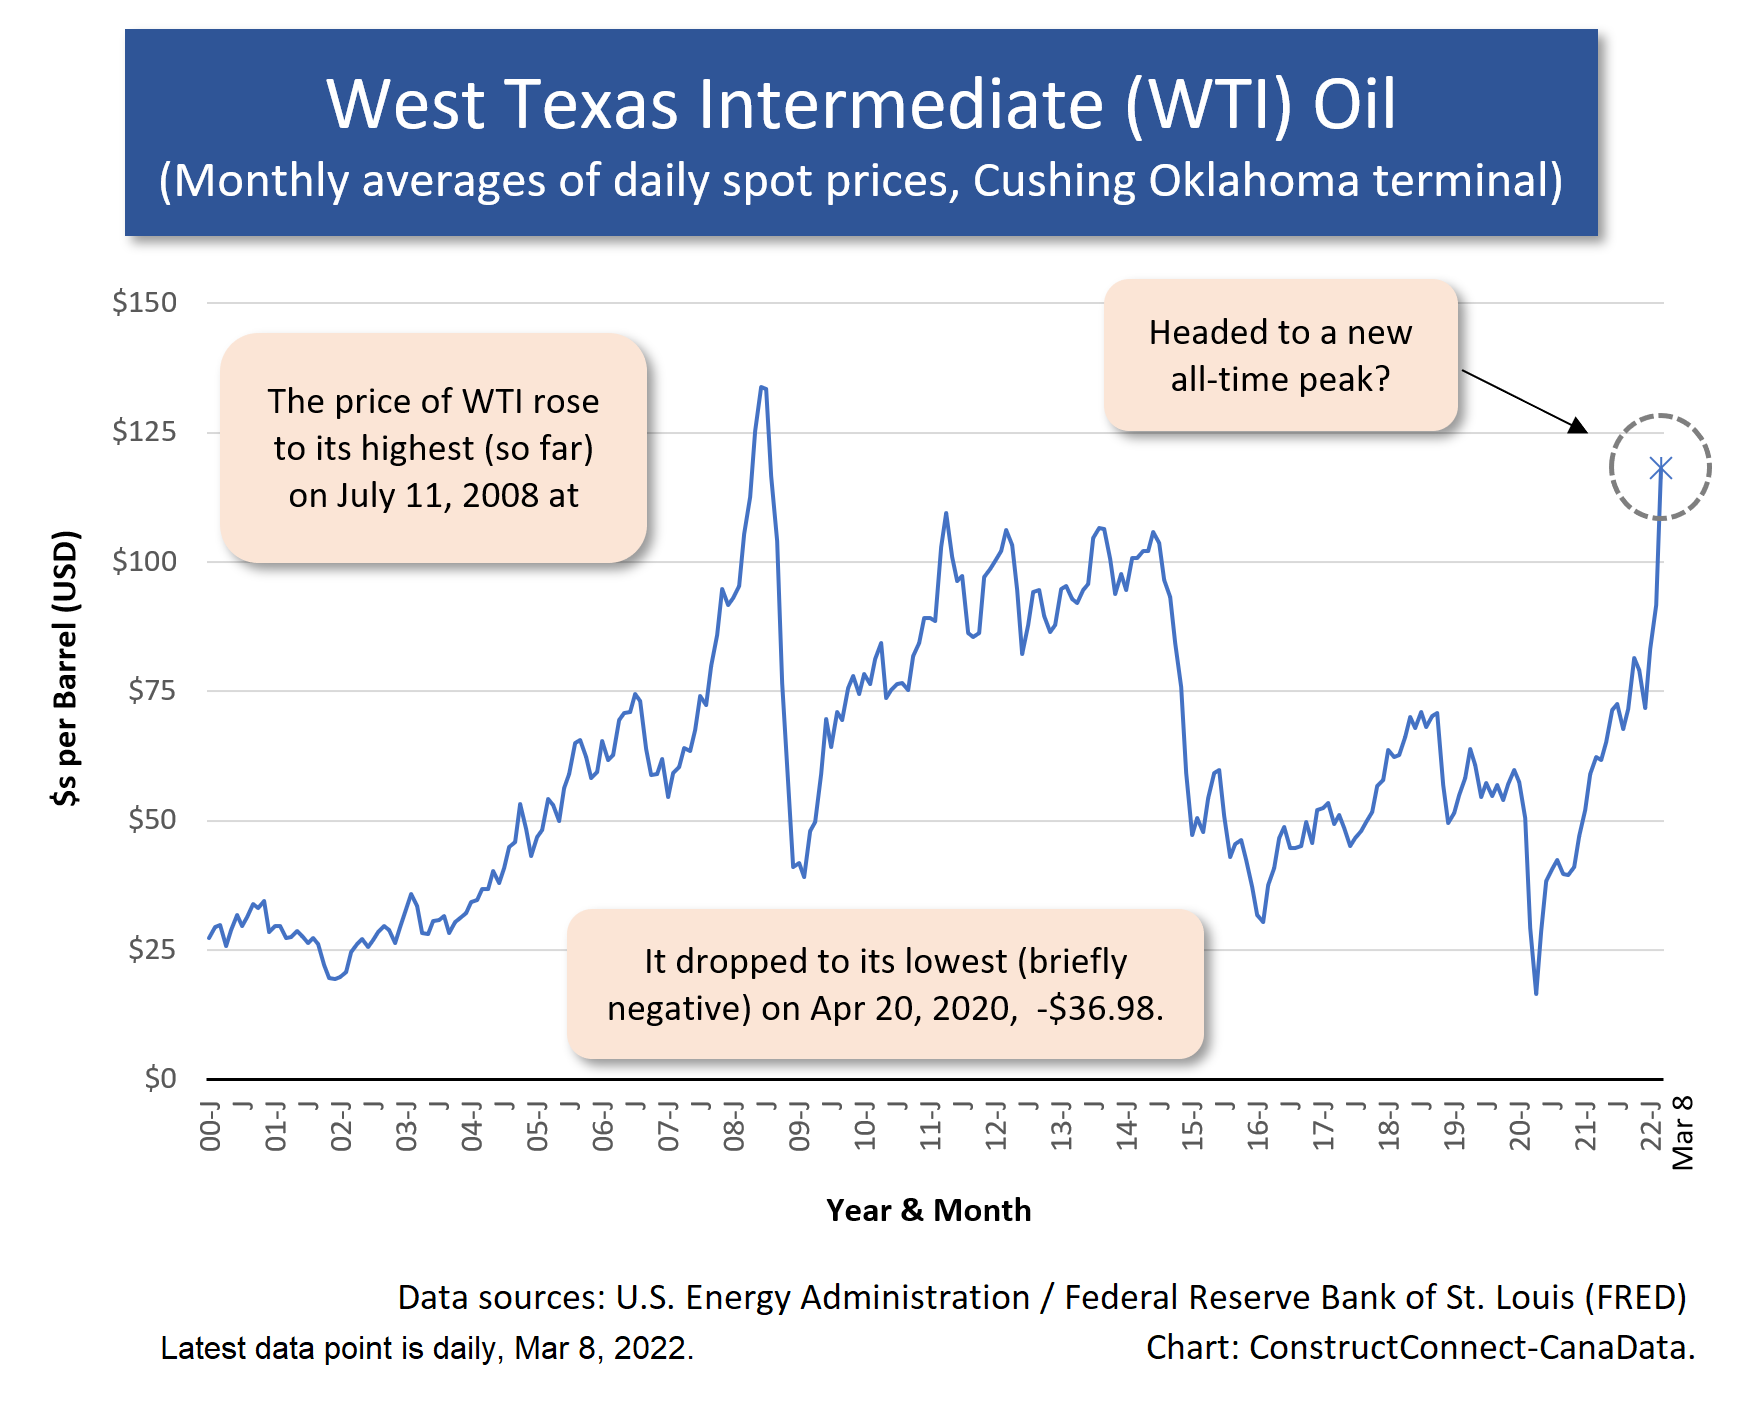
And then there’s what’s happening with the price of oil, which is a bellwether for inflation throughout the economy. Nearly everyone and every business is touched, in the wallet or purse, by the cost of filling up at the gas pump.
The danger to the global supply of oil posed by Russia’s incursion into Ukraine has sent the price of Brent crude, West Texas Intermediate (WTI) and Western Canada Select (WCS) soaring.
They haven’t yet quite reached new record highs, but they appear (see Graph 3) irrevocably set on that course.
Table 1
Graph 1
Graph 2
Graph 3
Alex Carrick is Chief Economist for ɫ��ɫ. He has delivered presentations throughout North America on the U.S., Canadian and world construction outlooks. Mr. Carrick has been with the company since 1985. Links to his numerous articles are featured on Twitter , which has 50,000 followers.

Recent Comments
comments for this post are closed