Statistics Canada has just released . They provide a detailed picture of the distribution of population across the country’s census metro areas (CMAs). Comparing the estimates for 2021 to the previous year reveals short-term shifts in population. However, longer-term comparisons of population filter out temporary changes and short-term shocks, thereby revealing underlying and likely persisting trends over extended intervals.
Kelowna the nation’s fastest growing CMA since 2016
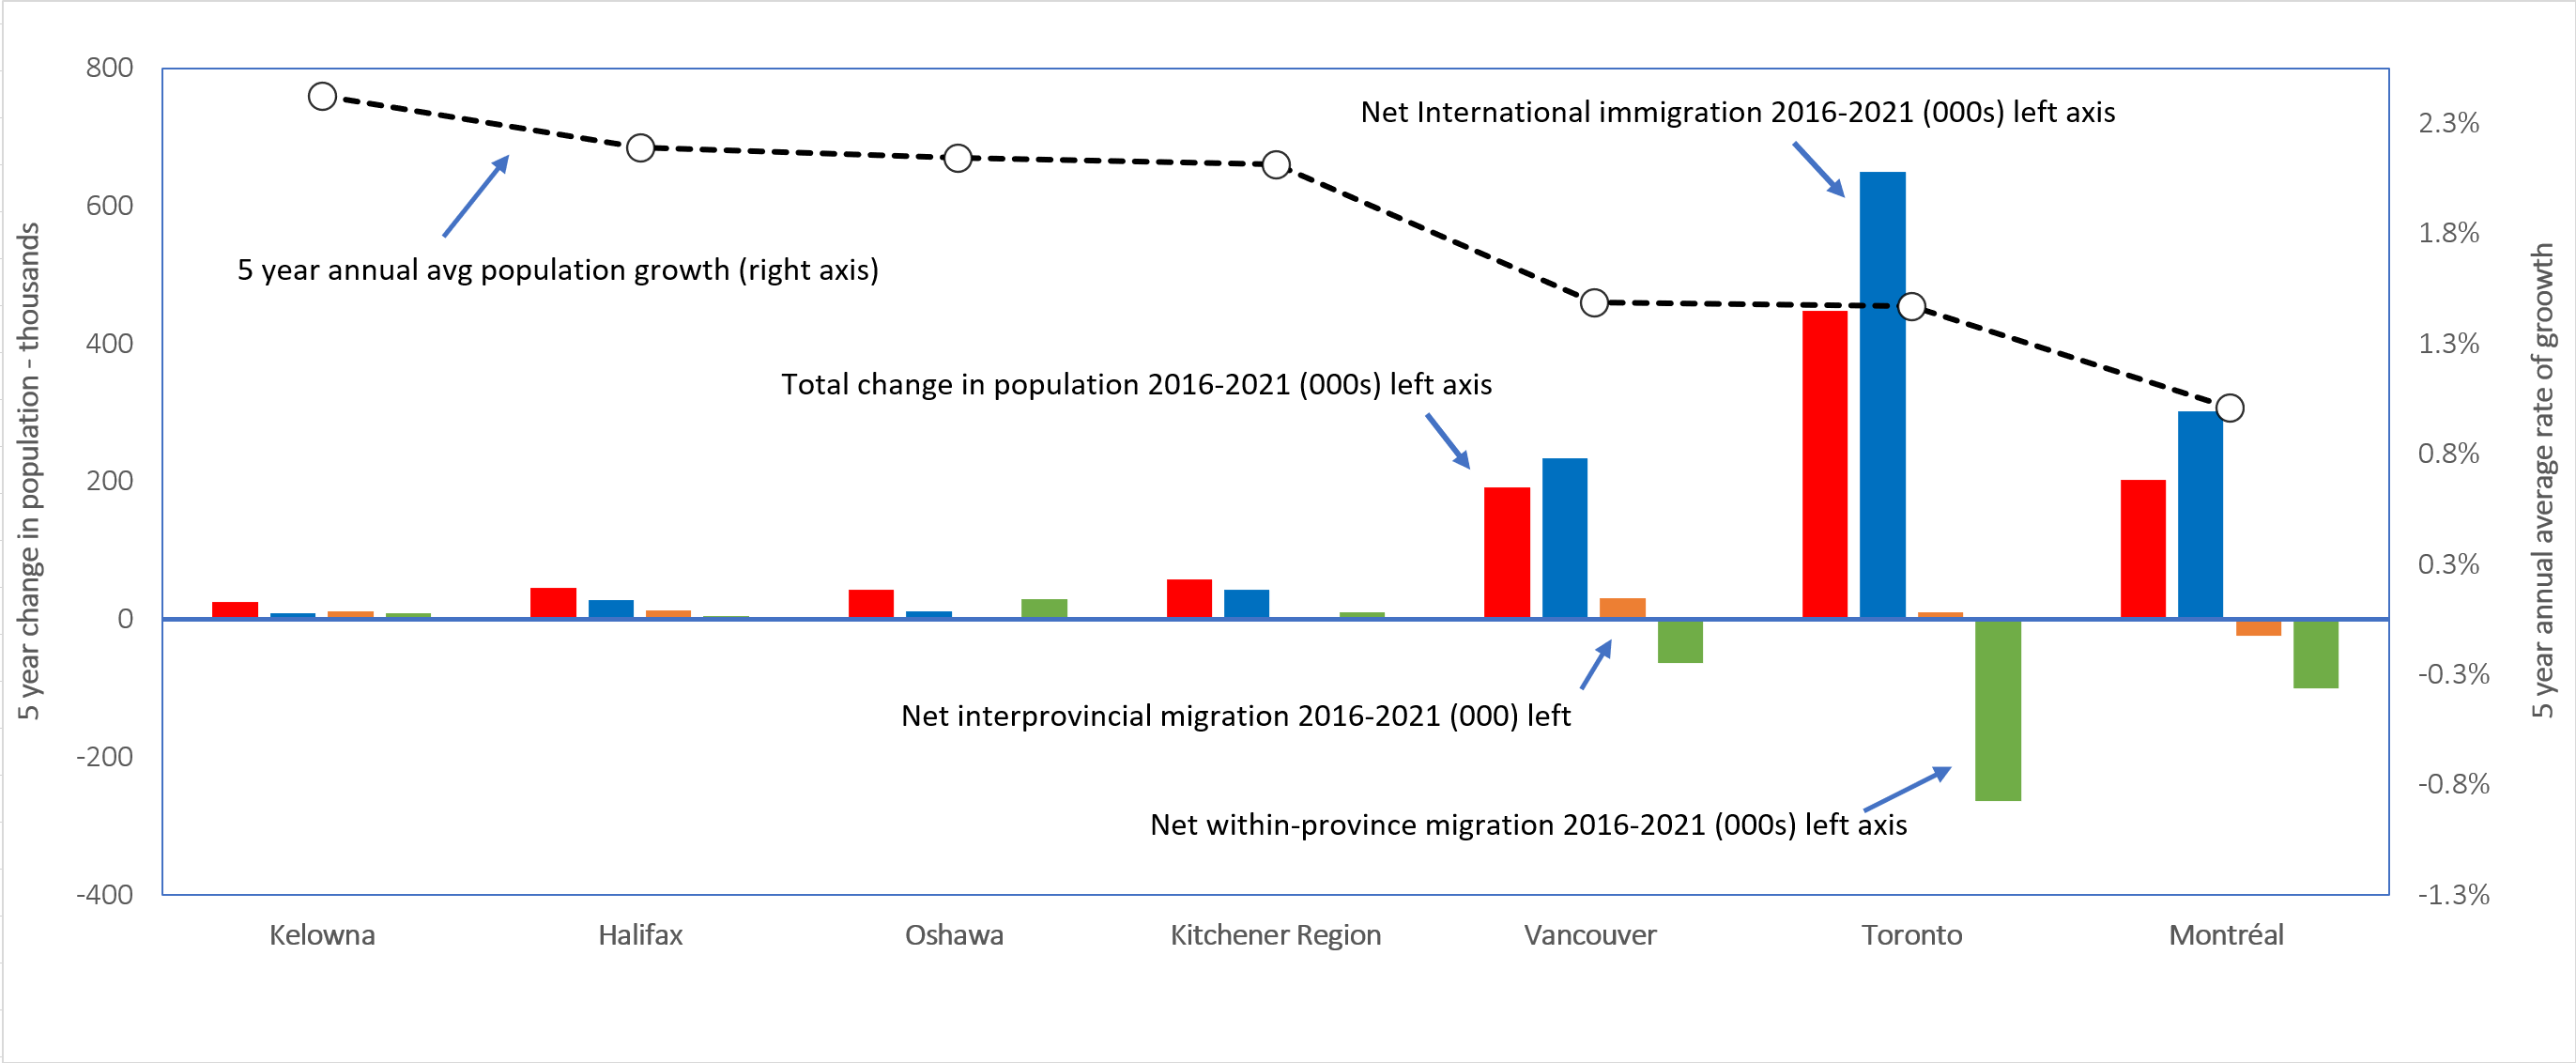
Over the past five years and across Canada’s 35 CMAs, Kelowna’s population has grown by +2.4% annually, more than double the national average of +1.1%. Since 2016, the city’s population has increased by +24,500 people, largely due to an inflow of +12,000 migrants from provinces outside British Columbia. In addition, an estimated +8,200 individuals have moved to the city from within B.C., to go along with the +4,300 non-permanent migrants from outside the country.��
Halifax, Oshawa, and Kitchener-Waterloo-Cambridge tied for second
Between 2016 and 2021, Halifax, Oshawa and Kitchener-Cambridge-Waterloo have all grown by an average of +2.1% per year, second only to Kelowna. Halifax has exhibited the most rapid acceleration in population growth over the past five years vs the previous five years. Driven initially by a surge in net international migration from 2016 to 2020, and more recently by a strong inflow from other provinces, the rate of increase in Halifax’s population has moved up from +0.5% annually (2010 to 2015) to +2.1% (2016-2021).
Since 2016, over two-thirds (69%) of the +43,000 increase in the population of Oshawa has been due to an inflow of migrants from within Ontario. This strongly suggests the acute shortage of affordable homes next door in Toronto is driving folks, many of whom are first-time buyers, to turn their sights east. Other contributors to Oshawa’s sustained strong population growth include an inflow of +5,000 permanent immigrants and +3,500 non-permanent migrants.
After posting growth averaging +0.9% y/y between 2010 and 2015, the CMA of Kitchener-Cambridge-Waterloo saw its population grow at an average +2.1% annually, 2016 to 2021, on account of a marked rise in inflows of non-permanent residents (+23,000), permanent residents (+18,400) and net intra-provincial migrants (+13,000).
International net migration crucial in Canada’s 3 largest CMA’s
Over the past five years, the population counts of two of Canada’s three largest CMAs have grown just slightly faster than for the entire country. Since 2016, the populations of Toronto and Vancouver have each increased on average by +1.4% annually, compared to the national average of +1.1%.��
By far the major contributor to the gain in Toronto’s population of +450,000 over the past five years has been a net inflow of +591,000 (both permanent and temporary) immigrants from outside Canada that has been partly offset by an outflow of -260,000 residents to other parts of the province, including the CMA of Oshawa (noted above).
Reflecting the deterioration in home affordability in Toronto, which has steadily intensified since 2015, the exodus of residents to other parts of the province between 2016 and 2021 was more than twice the outflow during the previous five years.
As with Toronto, the +190,000 increase in Vancouver’s population over the past five years has been primarily due to sustained growth of international migration, both permanent (+127,000) and non-permanent (+53,000). On the flip side, though, and reflecting that its housing market is the least affordable in Canada, the number of Vancouverites moving to other (less pricey) parts of the province escalated sharply from an average of +3,700 a year between 2010 and 2015 to an average of +12,500 between 2016 and 2020.��
Montreal, Canada’s second-largest CMA, saw its population grow, on average, by +1.0% over the past five years, just slightly below the national average, but marginally faster than the +0.8% growth it achieved on average during the previous five years. Despite efforts to limit international migration by Premier Francois Legault, Montreal’s population has increased by +200,000 mostly due to an inflow of +250,000 international (permanent and non-permanent) migrants that has been partly offset by an outflow of residents to other parts of the province (-100,000) and to other provinces (- 23,000).
More balanced population growth in 2022 and 2023
Looking ahead, the fact admissions of permanent residents in 2021 were higher in 27 of the country’s CMAs than they were in pre-COVID-2019 suggests that above-average city population growth will persist throughout 2022. Further, the federal levels over the next two years and the improving outlook for the country’s energy-producing provinces suggest the strong pattern of population growth across the majority of the country’s 35 CMAs will persist into 2023.
Population Growth in Canada’s 4 Fastest Growing & 3 Largest CMAs, 2016-2021

Chart: ɫ��ɫ — CanaData.
Please click on the following link to download the PDF version of this article:


Recent Comments
comments for this post are closed