
Due to its complexity, much of the subject matter concerning the economy requires detailed editorial commentary, often supported by relevant tables and graphs.
At the same time, though, there are many topics (e.g., relating to demographics, housing starts, etc.) that cry out for compelling ‘shorthand’ visualizations.
Whichever path is followed, the point of the journey, almost always, is to reach a bottom line or two.
To provide additional value, ɫ��ɫ is now pleased to offer an ongoing series of 1,000-word charts.
These will help readers sort out the ‘big picture’ more clearly.
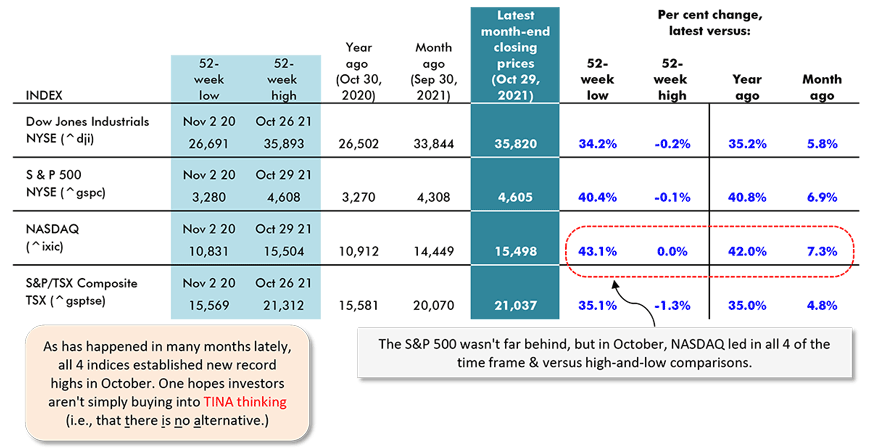
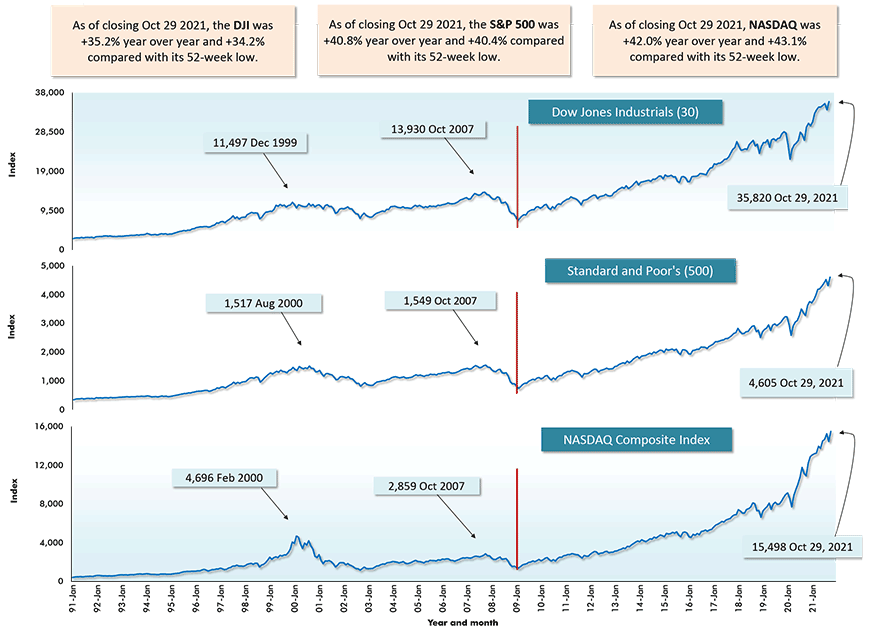
These 1,000-word charts look at the performances of the key stock market indices as of October 29, 2021.
Securities Dealers Automated Quotations (NASDAQ), Toronto Stock Exchange (TSE) and Reuters.
Table: ɫ��ɫ.
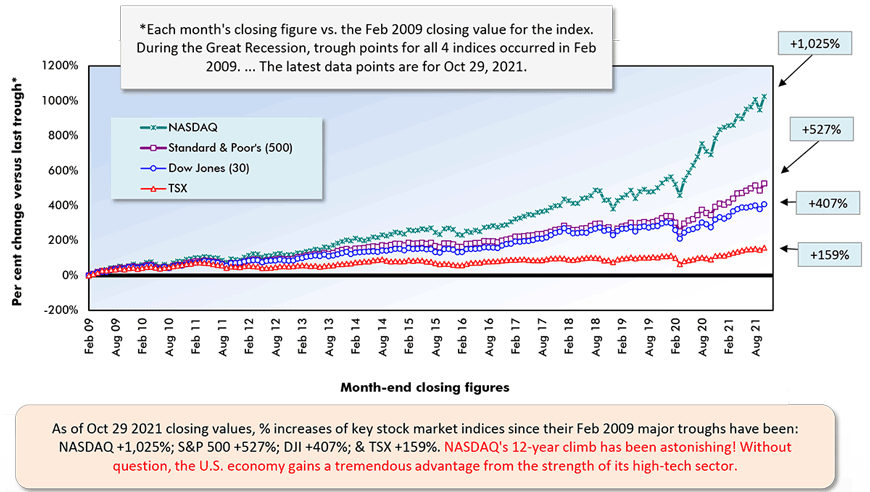
Red vertical lines denote Feb 2009 major ‘troughs’ for the indices.
Securities Dealers Automated Quotations (NASDAQ), Reuters & Yahoo.
Chart: ɫ��ɫ.
Securities Dealers Automated Quotations (NASDAQ), Toronto Stock Exchange (TSE) and Reuters.
Chart: ɫ��ɫ.
Securities Dealers Automated Quotations (NASDAQ), Toronto Stock Exchange (TSE) and Reuters.
Chart: ɫ��ɫ.
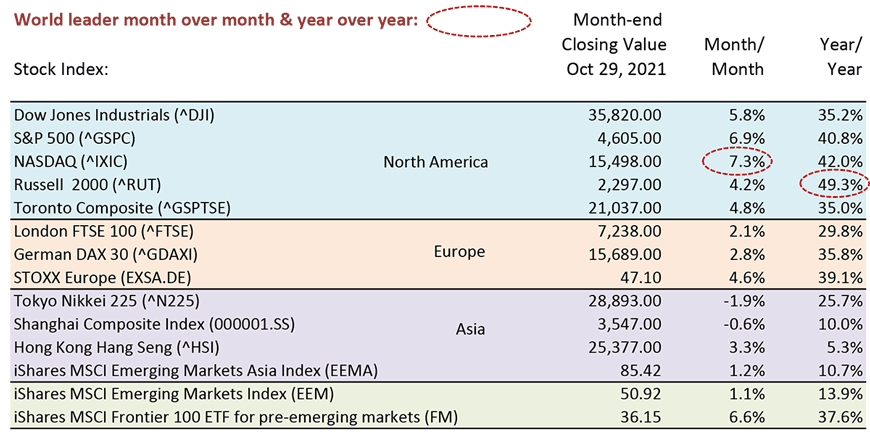
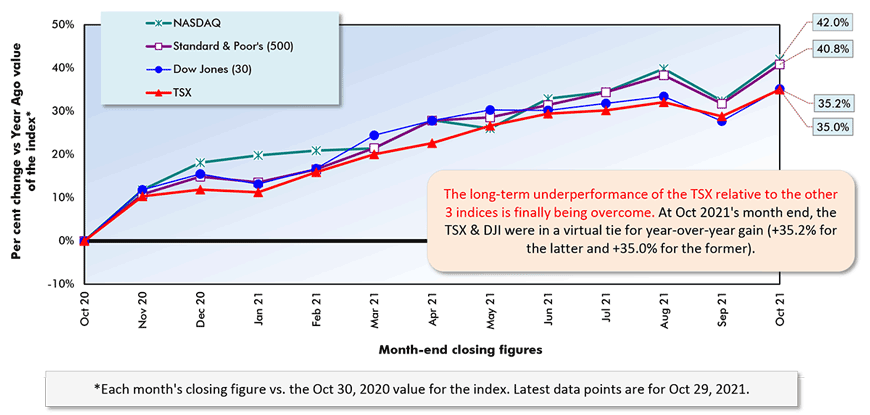
Table: ɫ��ɫ.
Year over Year as of Month-end Closings, October 29, 2021
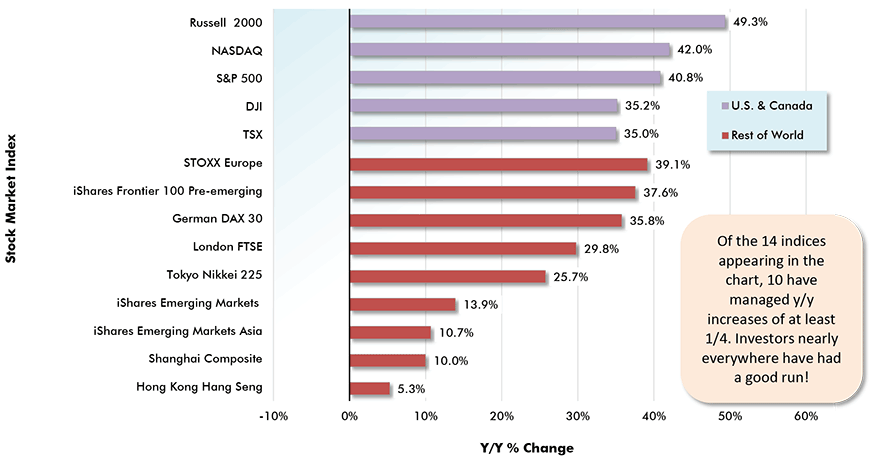
Chart: ɫ��ɫ.
Alex Carrick is Chief Economist for ɫ��ɫ. He has delivered presentations throughout North America on the U.S., Canadian and world construction outlooks. Mr. Carrick has been with the company since 1985. Links to his numerous articles are featured on Twitter , which has 50,000 followers.


Recent Comments
comments for this post are closed