As the U.S. and Canadian economies recover from horrific coronavirus-induced slides last year, it’s interesting to observe where, among cities, the pace is quickening most resoundingly.

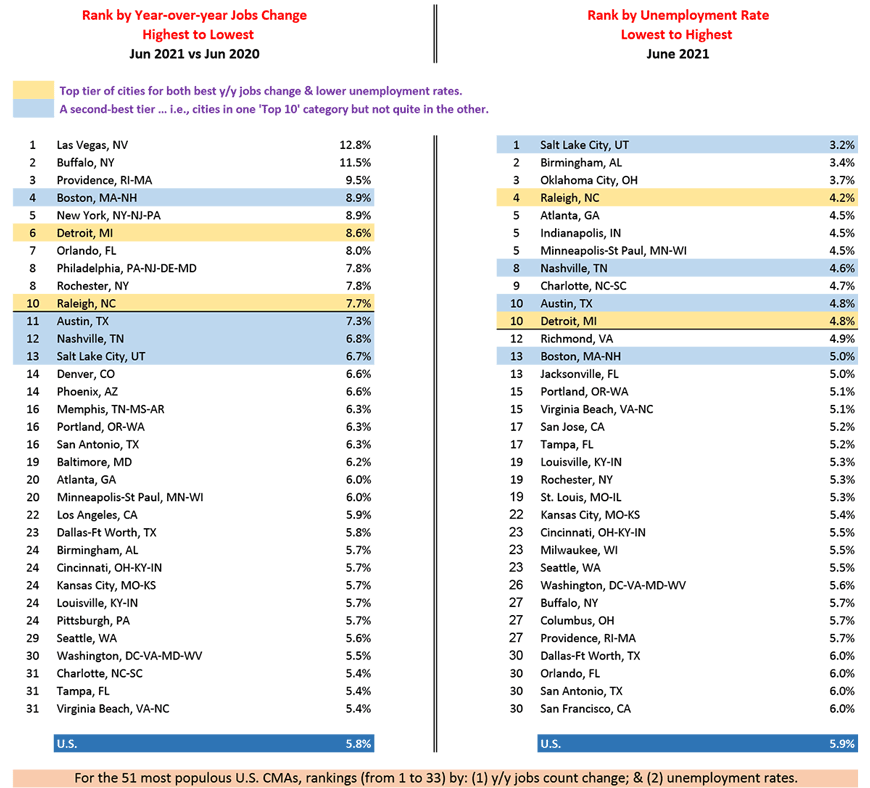
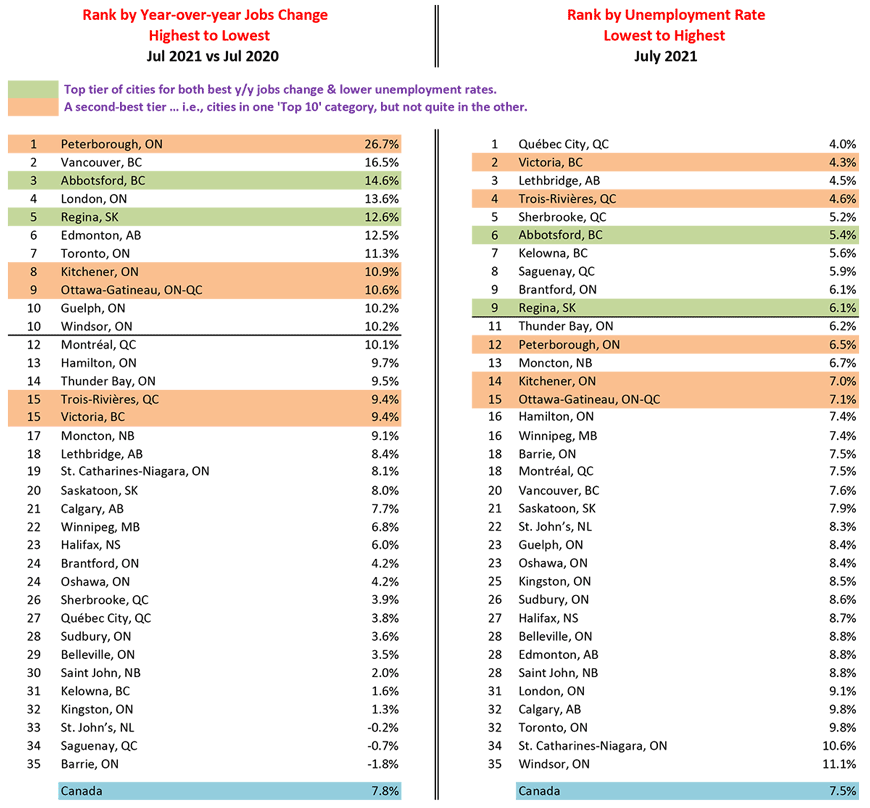
Tables 1 and 2 present relatively easy-to-understand assessments of city labor markets.
Each table features side-by-side rankings of cities according to year-over-year number of jobs changes (from fastest to slowest) and unemployment rates (lowest or tightest to highest or most severe).
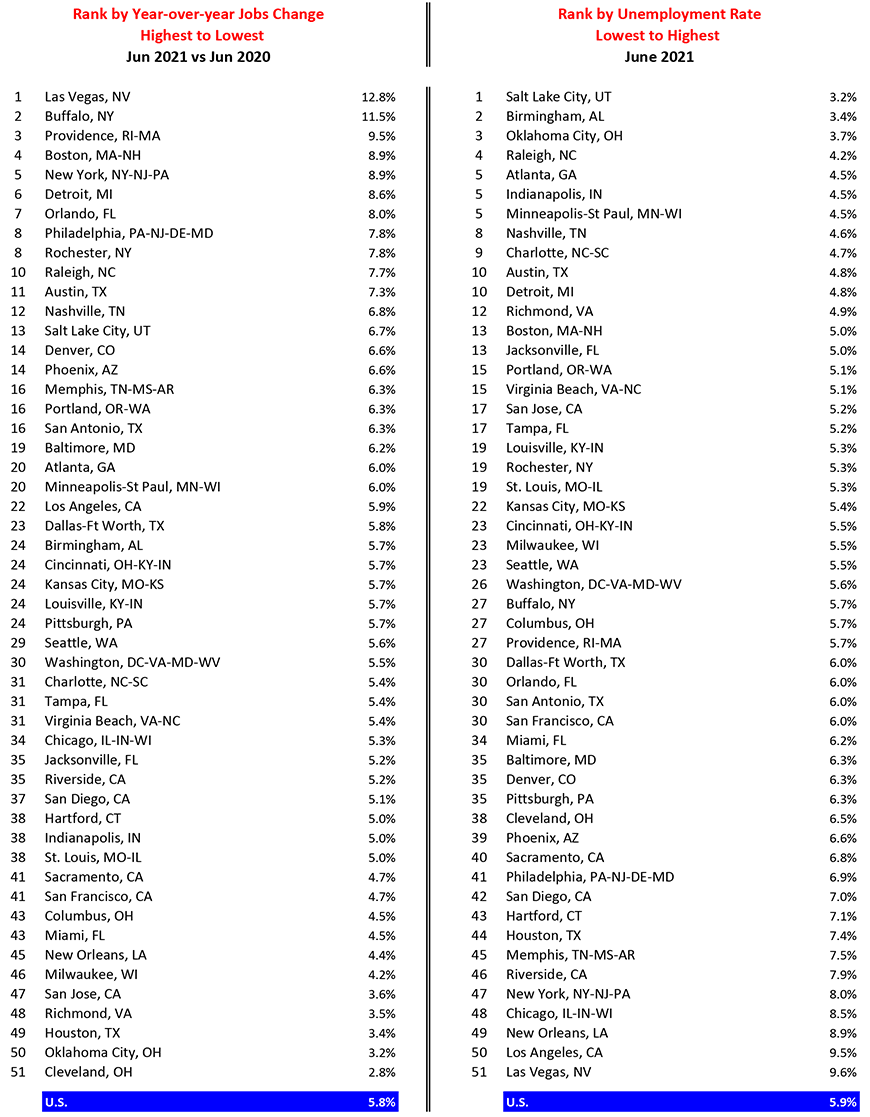
Table 1 is a condensed version of the whole data set for America’s 51 largest (by population) cities that appears at the end of this article. It has been shortened to the top 33 cities according to both criteria (jobs growth and U rate) for ease of posting to social media.
For Canada, Table 2 includes all 35 of the nation’s Census Metropolitan Areas (CMAs).
By the way, the latest available U.S. numbers are for June; for Canada, the coverage is through July. Sometimes Canadian data is a month ahead; but there are instances when it’s the other way around (e.g., retail sales statistics).
In Table 1, beige-colored highlighting shines a spotlight on the two U.S. cities that are among the Top 10 for both rapid jobs growth and low unemployment rates. According to this methodology, Raleigh and Detroit currently possess the Top Tier labor markets among America’s major cities.
The blue shading picks out another four cites warranting special acknowledgement because they are among the Top 10 on one side of the chart, but they have fallen just short of making it into the upper echelon on the other side.
The four cities making up the second tier of best U.S. labor markets are Salt Lake City, Boston, Nashville and Austin.
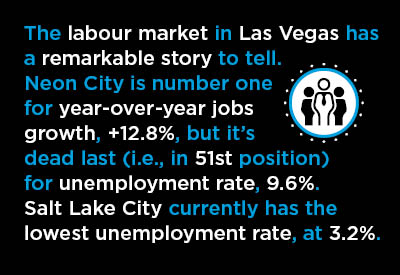
The labour market in Las Vegas has a remarkable story to tell. Neon City is number one for year-over-year jobs growth, +12.8%, but it’s dead last (i.e., in 51st position) for unemployment rate, 9.6%. The entertainment industry is on the comeback trail, but the drop in number of jobs this time last year was so deep, there remains a lot of ascending to do to climb out of the crater.
Table 1: Best U.S. City Labor Markets

Based on not seasonally adjusted (NSA) data. / Cities are metropolitan statistical areas (MSAs).
When the ranking numbers are the same, the cities are in a tie.
Data source: U.S. Bureau of Labor Statistics (BLS).
Table: ɫ��ɫ.
Adopting the same methodology to assess Canadian city labour markets, the two top tier cities (with green shading) presently are Abbotsford and Regina.
Additionally, there are five cities (with brown shading) that make up a second-or next-best tier ̶ Peterborough, Victoria, Trois-Rivières, Kitchener and Ottawa-Gatineau.
Table 2: Labour Markets in 35 Canadian Cities

Based on averages of latest three months, seasonally adjusted (SA) data. Cities are census metro areas (CMAs).
When the ranking numbers are the same, the cities are in a tie.
Table: ɫ��ɫ.
‘Composite’ Ranking Shines Spotlight on Boston and Vancouver
Admittedly, most of the cites performing best in Tables 1 and 2 are not among the largest population centers in either country.
Therefore, an additional ‘composite’ ranking proves useful. The composite ranking calculates the average of the jobs growth and U-rate rankings for each city and, in turn, places that number in an ordering from lowest to highest.
According to the ‘composite’ approach, the labor markets of the 12 most populous urban centers in the U.S. are led by Boston (ranked 4th out of 51), followed by Atlanta (7th spot out of 51), Philadelphia (24th), New York (26th), Dallas-Ft Worth and Phoenix (tied for 29th position), Washington D.C. (33rd), San Francisco (41st), Los Angeles (42nd), Miami (43rd), Chicago (48th) and Houston (50th).
Canada’s major urban and labour market hubs have Vancouver in the vanguard (7th out of 35), with Ottawa-Gatineau (9th) next in line; then come Montreal (13th), Edmonton (18th), Toronto (22nd) and Calgary (28th).
Table 3: Best U.S. City Labor Markets

Based on not seasonally adjusted (NSA) data. Cities are metropolitan statistical areas (MSAs). Often, the jobs change figure will be available a month ahead of the unemployment rate. When the ranking numbers are the same, the cities are in a tie.
Data source: U.S. Bureau of Labor Statistics (BLS).
Table: ɫ��ɫ.
Please click on the following link to download the PDF version of this article:
Alex Carrick is Chief Economist for ɫ��ɫ. He has delivered presentations throughout North America on the U.S., Canadian and world construction outlooks. Mr. Carrick has been with the company since 1985. Links to his numerous articles are featured on Twitter , which has 50,000 followers.


Recent Comments
comments for this post are closed