December 2020’s total employment figure in the U.S. declined by -140,000 jobs, according to the . Neither is this a surprise, nor is it quite as dire as it first seems.
The weekly jobless claims number has remained above 700,000 for 42 weeks in a row and it is still higher than the maximum level (655,000) that was reached in the 2008-2009 recession. Not much good on the jobs creation front will occur until the number of first-time unemployed begins to drop significantly.
And, of course, the new layoffs are coming as a result of surging coronavirus cases. Bars and restaurants that had been re-opening have been forced to cease or scale back operations once again.
Also, there’s been a revision to the previous month’s jobs count that somewhat alters the narrative. The latest estimate of November’s total employment has risen by +135,000 versus what was originally reported.
Therefore, the ‘truer’ net change in America’s total jobs count in the latest month was close to zero (-5,000).
The seasonally adjusted (SA) unemployment rate in December stayed at 6.7%, the same as in November, while the not seasonally adjusted U rate increased slightly, to 6.5% from 6.4%.
The jobs recovery or claw-back ratio, relative to February-April’s plummet in employment, stayed flat in the latest month, at 52.1%.
A number of industrial sectors managed quite respectable increases in employment in December, including construction, +51,000 jobs.
Other than construction, the biggest nominal gains were registered by ‘professional and business services’, +161,000 jobs; ‘retail’, +120,000 jobs; ‘transportation and warehousing’, +47,000; and ‘manufacturing’, +38,000.
Unfortunately, those jobs improvements were not able to withstand the onslaught of losses in ‘government’, -45,000 jobs; ‘education and health’, -31,000; and most consequential, ‘leisure and hospitality’, -498,000.
The -45,000 figure for government jobs resulted from shrinkages of -32,000 and -19,000 at the ‘local’ and ‘state’ levels, while there were 6,000 net hires by Washington.
‘Education and health’s’ jobs drop of -31,000 was comprised of -63,000 for ‘educational services’ and -7,000 for ‘social assistance’, while ‘health care’ payrolls expanded by +39,000.
‘Hospitals’ added +32,000 staff members.
‘Food Services and drinking places’ (-372,000 jobs) accounted for three-quarters of the ‘leisure and hospitality’ sector’s jobs carnage.
Graph 1: U.S.: Month-to-month Total Jobs Creation
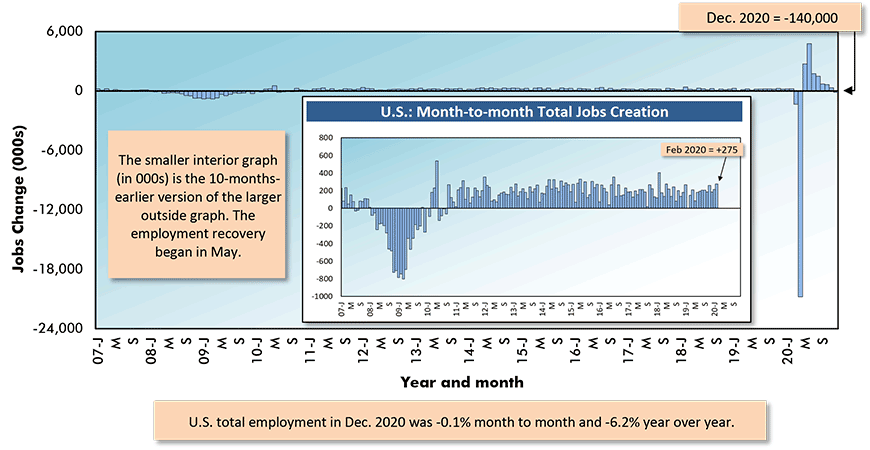
Chart: ɫ��ɫ.
Table 1: Monitoring the U.S. Employment Recovery – December 2020
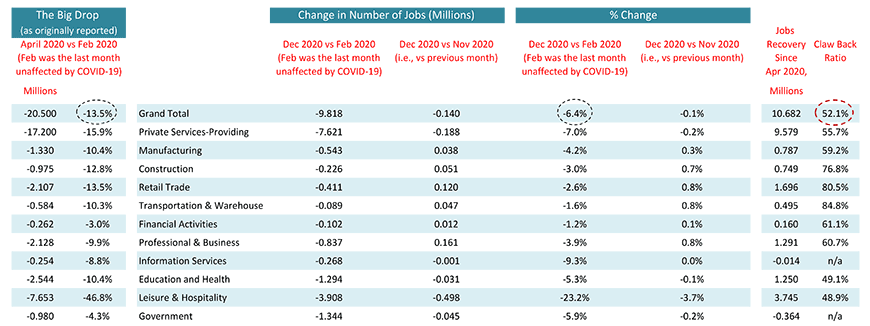
Chart: ɫ��ɫ.
Canada Watches 63,000 Jobs Disappear
Similar to the U.S., Canada experienced a weakening in labor market conditions in December.
Canada’s total jobs count declined by -63,000 jobs, causing the jobs-recovery ratio to retreat from 80.9% in November to 78.8% in December.
Almost all of the -63,000 figure for total jobs originated in ‘accommodation and food services’, -57,000.
Canadian manufacturing employment in the latest month was +15,000, but the number of construction jobs was -3,000.
One of the few pieces of good news contained within was that full-time jobs in the latest month were +36,000. It was part-time work that suffered the ‘slings and arrows’ of severe layoffs, -99,000.
Graph 2: Canada: Month-to-month Total Employment Change
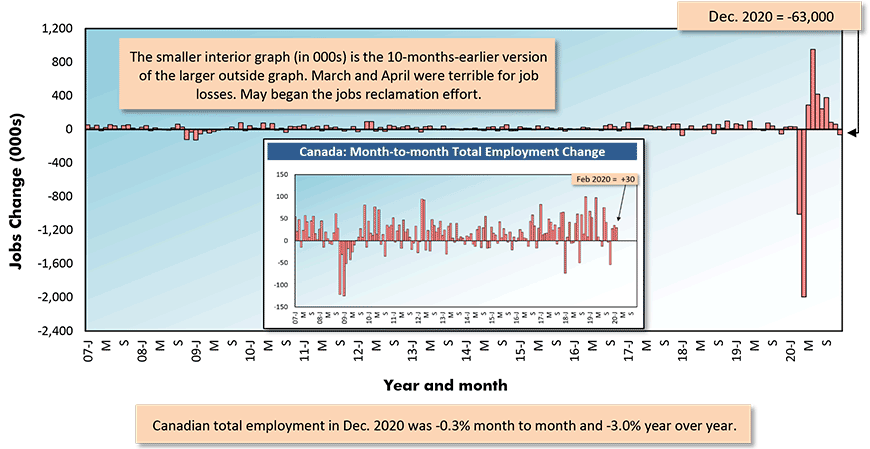
Table: ɫ��ɫ.
Table 2: Monitoring the Canadian Employment Recovery ‒ December 2020
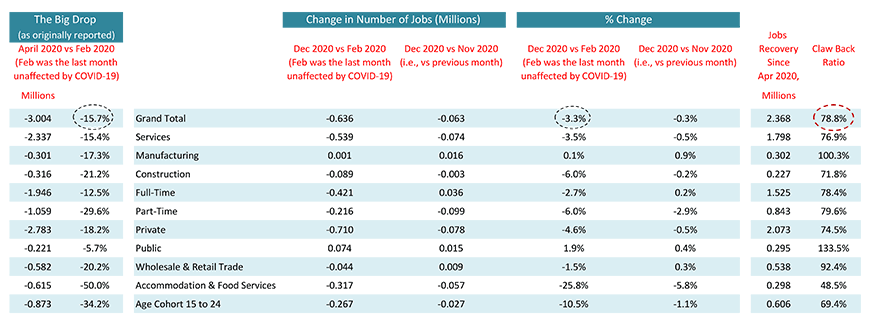
Table: ɫ��ɫ.
Table 3: U.S. and Canadian Jobs Markets – December 2020
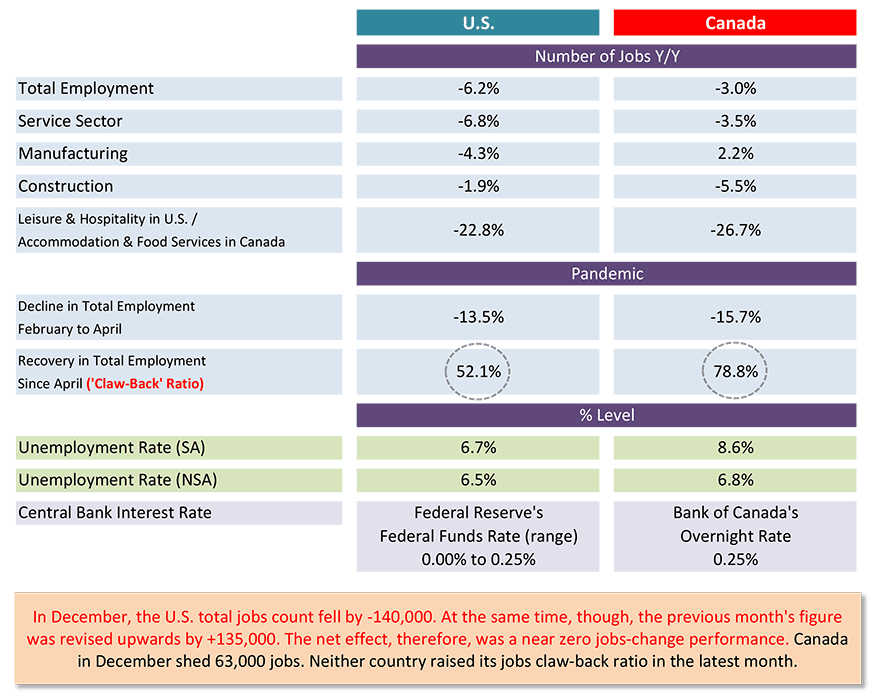
U.S. labor data is from a ‘payroll survey’ / Canadian labour data is from a ‘household survey’.
Canadian NSA unemployment rate ‘R3’ is adjusted to U.S. concepts (i.e., it adopts U.S. equivalent methodology).
Table: ɫ��ɫ.
Alex Carrick is Chief Economist for ɫ��ɫ. He has delivered presentations throughout North America on the U.S., Canadian and world construction outlooks. Mr. Carrick has been with the company since 1985. Links to his numerous articles are featured on Twitter , which has 50,000 followers.


Recent Comments
comments for this post are closed